Performance profiler
Performance profiler
Reference: https://docs.microsoft.com/en-us/visualstudio/profiling/profiling-feature-tour?view=vs-2019
Analyze performance of .NET asynchronous code
This content we’ll use .NET Async Tool for detect and improvement our Web API
Steps
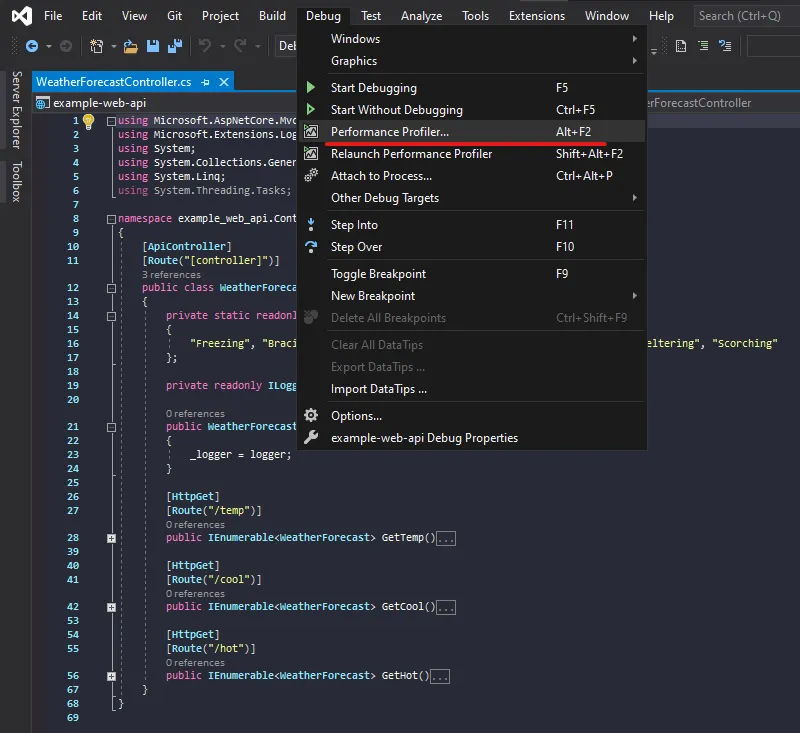
- Go to Debug and select Performance profiler or press Alt+F2
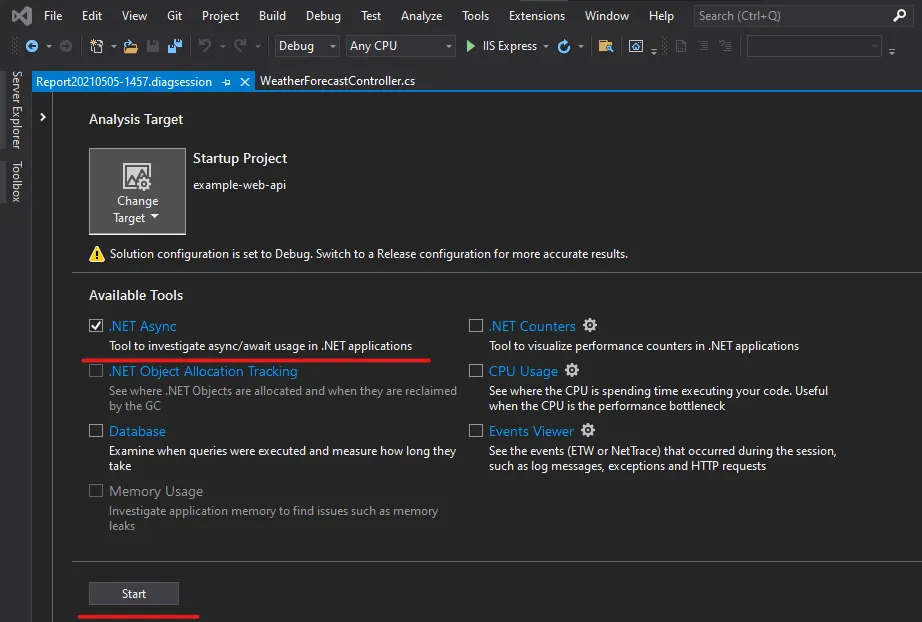
- Select .NET Async then Start
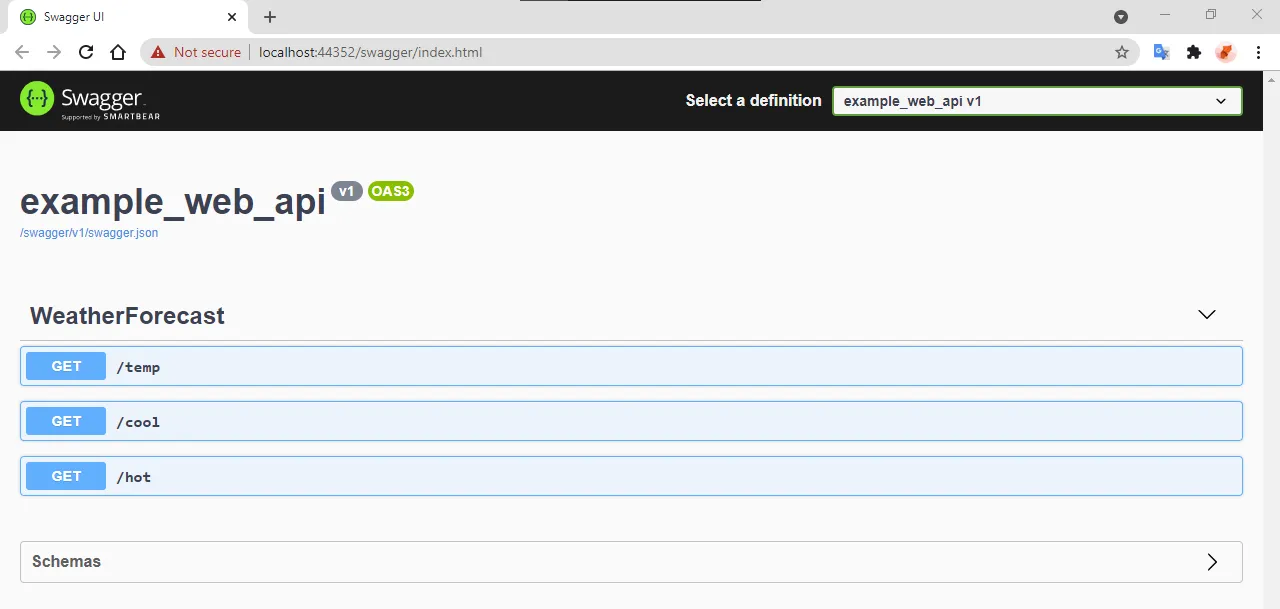
- Go to Swagger UI then select your end point. Press Try it out and Execute.
In this content we select all end point.
- /temp
- /cool
- /hot
- If you done. Back to visual studio and press Stop Collection.
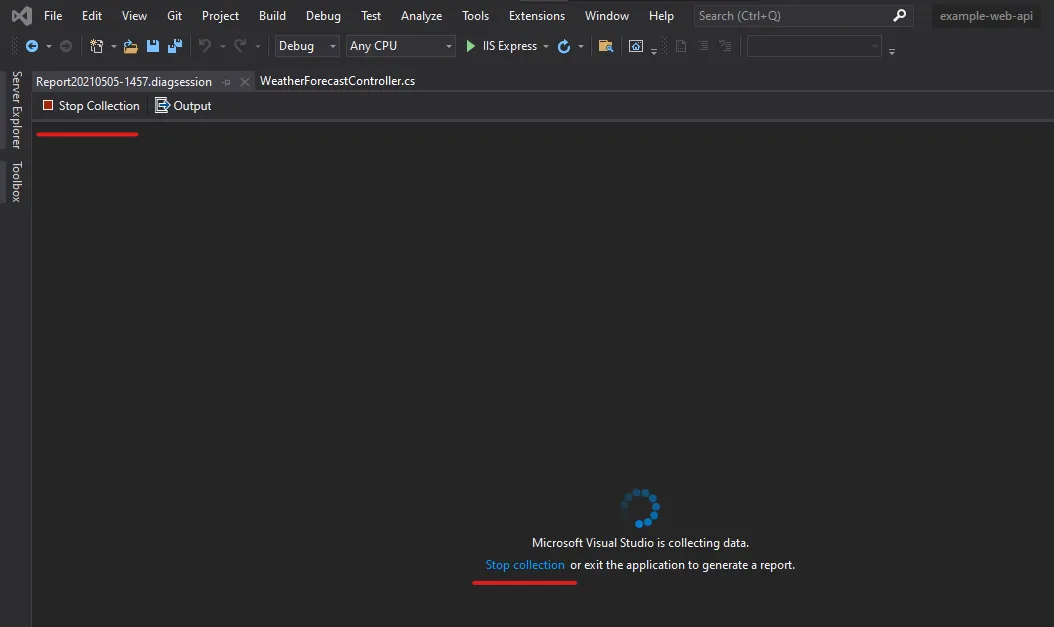
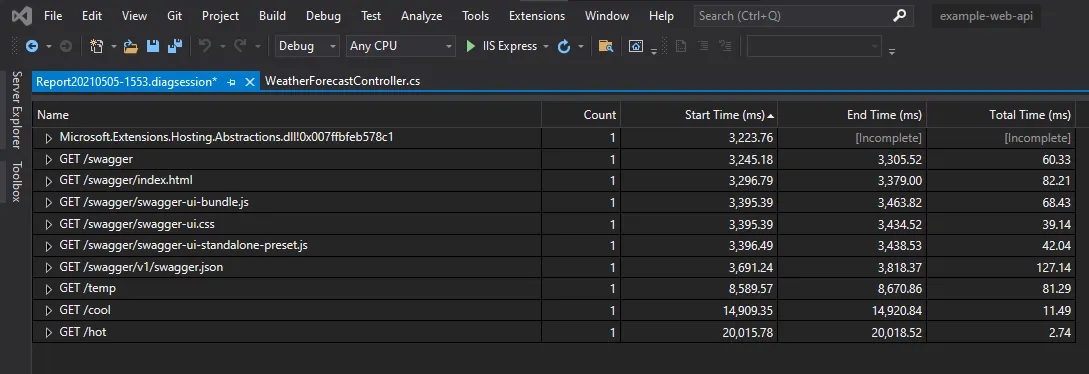
Result
Completed!
We’ll see the result displays its start time, end time, and duration.
We can use this to find the end point of slow processing.